It’s “Big and Beautiful”

The so-called “One Big Beautiful Bill” making its way through Capitol Hill has sparked intense debate, particularly among fiscal conservatives and budget deficit hawks. Supporters promote the bill as a sweeping, comprehensive reconciliation package that aims to consolidate tax cuts, spending reforms, and Medicaid restructuring into a single piece of legislation. By advancing the bill through the budget reconciliation process, backers hope to bypass filibusters and secure passage with simple majorities.
The bill’s initial passage in the House of Representatives in May triggered swift backlash. Surprisingly, one of the President’s own allies—previously a champion of cost-cutting and government efficiency—voiced strong opposition online, calling the bill “ugly,” “disgusting,” and an “abomination.” The President, in response, expressed disappointment and hinted at potential political repercussions for dissenters within his ranks.
At its core, the “Big Beautiful Bill” aims to make the 2017 tax cuts permanent. If Congress does not act, those tax cuts are set to expire, resulting in higher marginal tax rates for millions of Americans. The bill also proposes temporary business tax relief through accelerated depreciation on capital investments, expands funding for border and defense security, eliminates various clean energy incentives, and cuts $1.7 trillion from Medicaid.
According to estimates from the nonpartisan Congressional Budget Office (CBO), the bill would add an extra $300 billion per year to the federal budget, which is already projected to be $1.9 trillion for 2025. Consequently, annual federal deficits are expected to exceed $2.2 trillion for the foreseeable future. If this trend continues, total federal debt could reach $60 trillion by 2035—unless bond markets respond by demanding higher interest rates, effectively limiting the government’s borrowing capacity.
The hope is that new government spending should be balanced by future economic growth. However, if tax cuts expire and growth slows, the overall effect could be more detrimental than beneficial. Adding to the issue is inflation, which has already diminished household wealth. Since 2019, American consumers have lost approximately 20% of their purchasing power, largely due to pandemic-era stimulus and subsequent price increases. In this context, inflation functions as a hidden tax on personal wealth.
“Supporters see the ‘Big Beautiful Bill’ as a bold step toward permanent tax relief, streamlined spending, and stronger national security.”
In May, as the bill progressed to the Senate, a major U.S. credit rating agency downgraded the nation’s debt, citing concerns echoed by fiscal conservatives about long-term deficits, rising interest rates, and persistent U.S. dollar weakness. Nevertheless, some economists argue that the $36 trillion national debt must be viewed in relation to the vast wealth and productive capacity of the United States. From that perspective, a full-blown debt crisis may still be distant.
Tariffs
President Trump’s tariff policies have been the primary driver of recent economic and market volatility, leading to a phenomenon known as the “TACO trade,” an acronym for “Trump Always Chickens Out”. The “trade” refers to investors betting on de-escalation after initial tough talk, a strategy that has recently been somewhat effective in the markets.
Legal challenges are now also adding to global trade complexities and uncertainty. A US trade court recently blocked a variety of the tariffs initially announced on “Liberation Day”, claiming that the President does not have unbound authority to enact such tariffs. A federal appeals court temporarily allowed the tariffs to remain in place the very next day.
There have been periods of truce and tensions in various international trade relations. Specifically, the relationship with China has been back-and-forth with both sides claiming the other violated the agreed upon trade truce. Also, a delay of the 50% tariffs on the European Union is allowing for expedited talks, and the EU agreed to speed up negotiations on key sectors.
The tariffs aim to reduce the trade deficit, and although our deficit narrowed sharply in April, it was due to imports plunging ahead of the new tariffs going into effect. Tariff revenues have significantly increased, topping $22 billion in May alone and totaling over $92 billion since the first of the year. Historically, tariff revenue represented roughly 2% of the government’s revenue, and in recent months it has been about double that number.
Economy & Labor
The economic outlook remains clouded by uncertainty associated with the evolving tariff landscape, magnified by the ongoing legal challenges to tariffs. This is leaving both the market and the Fed awaiting more definitive data before making major moves. The full economic impact of the tariff policies is yet to be fully realized in official data.
Consumer spending, which accounts for over two-thirds of our country’s economic activity, slowed in April. It increased only marginally by 0.2% after a preemptive buying surge in March ahead of the new tariffs.
“Despite global trade uncertainty, the U.S. labor market continues to show resilience, with job gains surpassing expectations and unemployment holding steady.”
The US labor market is currently presenting a mixed and somewhat contradictory picture, with signs of both resilience and softening. In May, more jobs were added relative to expectations, and the unemployment rate held steady at 4.2%. However, the prior month’s job figures were revised downward. Job openings unexpectedly rose in April, indicating that labor demand is not in a bad place. Yet, hiring and quit rates are hovering near decade lows. Employers are appearing to remain cautious, seeking greater clarity on the policy outlook.
A general concern for the recent jobs data is that it likely does not capture the adverse impact of trade policy quite yet. More of those effects are expected to be seen in the July and August reports. Also, the overall cooling trends may suggest that employment and wage growth may be insufficient to completely absorb the impacts of the new global trade environment.
Federal Reserve
The Fed policymakers are not aligned on their beliefs around future monetary policy, and much of the debate is centered on tariff-related inflation; will it be temporary or persistent?
Certain Fed board members are adamant about maintaining current interest rate levels due to concern that inflation caused by tariffs will lead to persistent long-term inflation. The risk is that interest rate cuts could spiral inflation “higher for longer.”

Conversely, other Fed board members, along with President Trump, believe that inflation resulting from tariffs will be temporary. The belief is that a strong job market and progress on inflation will offer additional time to determine how trade negotiations play out. This could potentially allow for rate cuts later this year if inflation continues to make progress toward the Fed’s 2% goal and the job market remains solid. Trump continues to publicly pressure Fed Chair Powell to cut rates through a variety of colorful comments, yet Powell has maintained his stance.
“The Fed policymakers are not aligned on their beliefs around future monetary policy, and much of the debate is centered on tariff-related inflation; will it be temporary or persistent?”
The Fed’s preferred inflation measure, the Personal Consumption Expenditures, or PCE, index rose 2.5% on an annual basis as of April. This was lower than the month prior and a welcome development to show inflation data has not yet been negatively affected by tariffs.
The Fed has not altered its benchmark rates at all in 2025 after reducing them by a full percentage point at the end of 2024, citing uncertainties about Trump’s policies. The Fed’s “dot plot” is a visual representation of each Fed board member’s projections for the future path of rates. The most recent dot plot, from March, implies two quarter-percent rate cuts in 2025. But that reality is uncertain and based on the evolution of trade policy.
Stocks
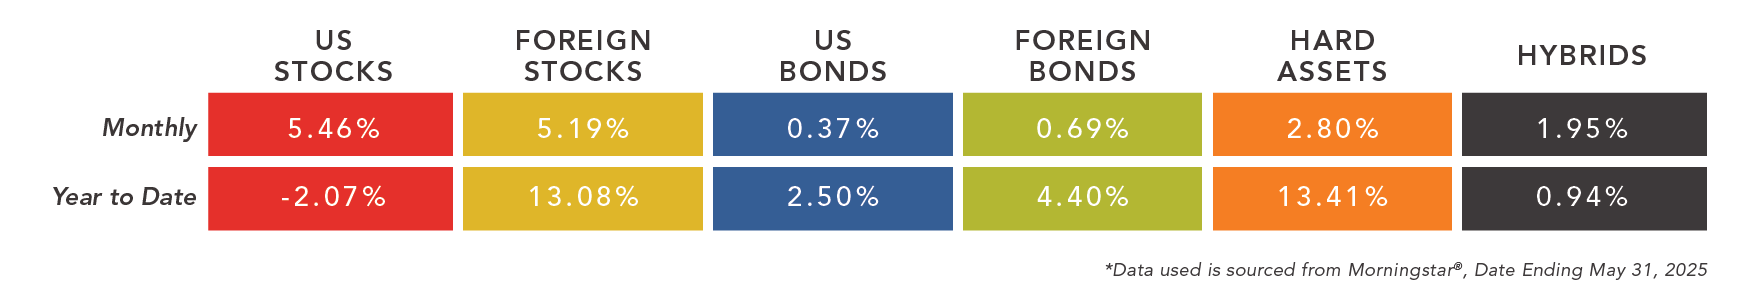
Stocks have continued to rebound from the year-to-date lows experienced in April. Global equity markets were up around 5% for the month of May, bringing the US large cap markets to positive territory for the year. US small cap stocks had a great month but are still holding on to negative year-to-date returns. Small caps continue to fall under pressures related to tariffs, interest rates, and inflation.
Foreign stocks continue to show tremendous strength relative to the US markets. The international markets have generated similar returns as US stocks for the month of May, but the return gap between these large stock markets on a year-to-date basis is significant, over 15% in most cases. Foreign and US stocks are maintaining generally equivalent three year average returns, which has been quite the comeback for foreign markets.
There are still quite a few unanswered questions related to the future landscape for equity markets. Lingering tariff, inflationary, and elevated interest rate issues could negatively impact stock earnings and future stock prices. Yet, momentum with tax incentives and deregulation could be pro-growth and benefit stock markets. We believe that a proper understanding of these dynamics and refraining from emotionally driven decisions is critical to navigating future portfolio allocations. Our team continues to monitor this environment closely.
Bonds
The 10-year Treasury yield climbed to approximately 4.45% in early June, up from 4% in April. The 30-year Treasury yield surpassed the 5% mark again in late May. Yields have remained elevated for a variety of reasons, but the expanding national debt has emerged as a growing concern. This concern was spurred on by Moody’s downgrade of the US credit rating on May 16. This downgrade underscores concerns that growing debt and deficits could introduce serious challenges ahead. A related concern is that this may cause increases in the interest paid by corporations relative to treasury bonds, known as credit spreads.
Higher yields translate into increased borrowing costs for consumers and businesses, which can slow economic activity. Governments may also face difficulties financing their operations if interest rates become too high. The US is currently rolling a massive amount of debt on a weekly basis.
Bond investors seem to be pulling back from longer-dated Treasuries, partly due to diminishing expectations for rate cuts by the Fed and a lower perceived chance of a recession. It can be challenging for investors to hold long term bonds through the constant price volatility that has been experienced. Another dynamic is that Trump’s new tax bill could lead to larger deficits. This could lead to steeper yield curves, where investors demand greater interest payments for lending to a government with growing debt.
Similar to the equity markets, foreign investments have performed better than similar US assets throughout the tariff-related volatility. Yet, US bonds have still generally outperformed foreign bonds by a large margin on a longer-term basis.
Lower quality bonds, such as high yield bonds and bank loans, had a strong month of May. These bond assets have been some of the best performers for quite some time relative to most bond sectors that have had lackluster performance.
© Advisory Alpha. Registration with the SEC or state does not constitute an endorsement of the firm by regulators, nor does it indicate that the adviser has attained a particular level of skill or ability. This content is for informational purposes only and does not intend to make an offer or solicitation for the sale or purchase of any securities. Investing involves risk, including the potential loss of principal. No investment strategy, such as asset allocation or diversification, can guarantee a profit or protect against loss in periods of declining values. All investment strategies involve risk and have the potential for profit or loss. Changes in investment strategies, contributions or withdrawals, and economic conditions may materially affect the performance of your portfolio. There are no assurances that a portfolio will match or outperform any particular benchmark. Investors should carefully consider the investment objectives, risks, fees, and expenses before investing. Any financial services firms referenced in this material do not provide tax or legal advice. Please consult with your tax or legal professional regarding specific issues prior to making a tax or legal decision.
The performance information presented in the asset category section of this report is based on equal-weighted averages of the following Morningstar Categories: US Stocks (US Fund Large Blend, US Fund Mid-Cap Blend, US Fund Small-Blend), Foreign Stocks (US Fund Foreign Large Blend, US Fund Foreign Small/Mid Blend, US Fund Diversified Emerging Mkts), US Bonds (US Fund Intermediate Government, US Fund Inflation-Protected Bond, US Fund Corporate Bond, US Fund High Yield Bond, US Fund Bank Loan), Foreign Bonds (US Fund World Bond, US Fund Emerging Markets Bond), Hard Assets (US Fund Commodities Precious Metals, US Fund Commodities Energy, US Fund Global Real Estate, US Fund Real Estate), Hybrid Assets (US Fund Convertibles, US Fund Preferred Stock).
© 2025 Morningstar. All Rights Reserved. The information contained herein: (1) is proprietary to Morningstar and/or its content providers; (2) may not be copied or distributed; and (3) is not warranted to be accurate, complete, or timely. Neither Morningstar nor its content providers are responsible for any damages or losses arising from any use of this information. Past performance is no guarantee of future results. Morningstar category data is provided for illustrative purposes only to demonstrate a hypothetical investment vehicle represented by a group of similar investments. Morningstar category data is an aggregation across actual funds contained in the category, but it is not possible to directly invest in a category. Index returns are provided for illustrative purposes only to demonstrate a hypothetical investment vehicle using broad-based indices of securities. Unmanaged indexes are not available for direct investment. All data shown does not include internal fund expenses, trading costs, financial advisor fees or commissions, or taxes. This information is not intended to predict the performance of any specific investment or security. Past performance is no guarantee of future results.
Bureau of Labor Statistics. Unemployment Rate, Total Nonfarm Employment, Labor Force Participation, Consumer Price Index, Producers Price Index. www.bls.gov. United States, Department of Commerce, Bureau of Economic Analysis. Personal Consumption Expenditures, Gross Domestic Product, Consumer Spending, Personal Income and Outlays. www.bea.gov. Federal Reserve. Fed Funds Rate, Fed Funds Target Range, Minutes of the Federal Open Market Committee, Board of the Federal Reserve System Calendar. www.federalreserve.gov. Trump, Donald. @realDonaldTrump. Truth Social.